Your weather station online
We provide two web applications that you can use or embed in your own pages. WxReport provides a complete set of charts over time. WxConsole just provides quick realtime information and charts over one day.
WxReport
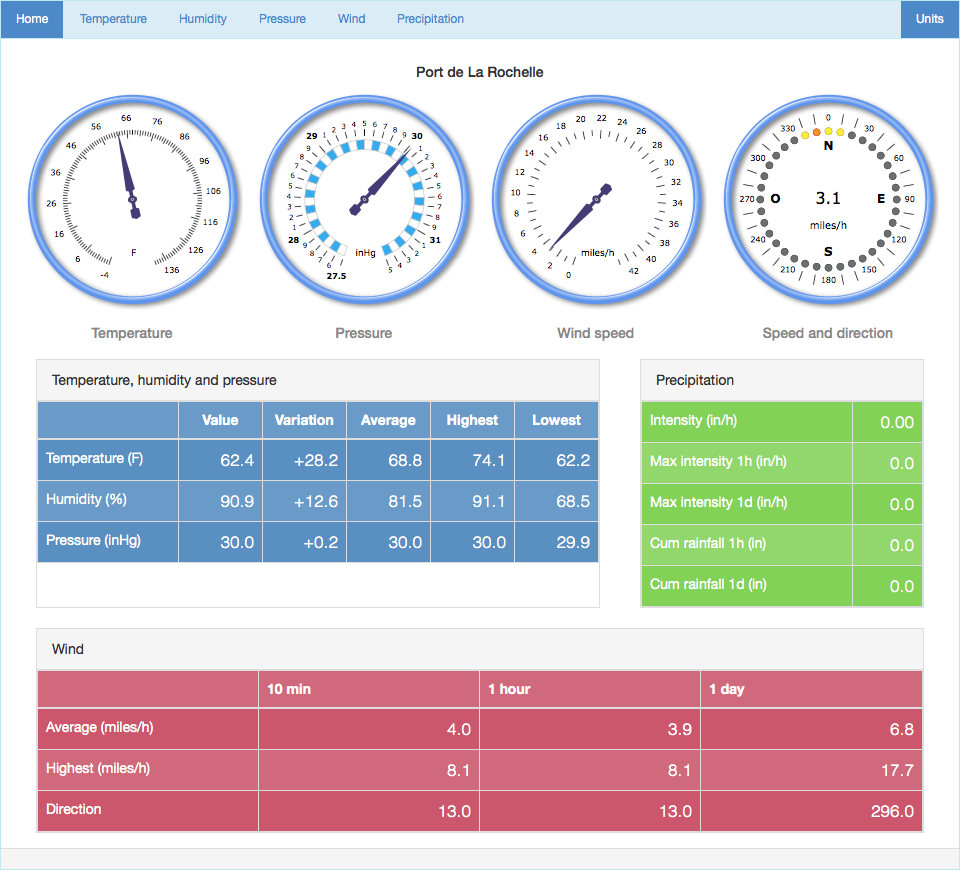
Your station is made available through our 'Weather Report' HTML5 application. The application can be viewed online or embedded in your web site using an iframe tag.
The dashboard displays a summary of current conditions but also daily high, low, average indicators.
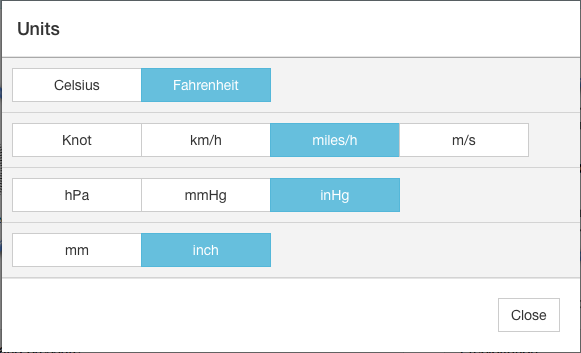
Users just select once the units they want to use. Preferred units are then stored locally to avoid users setting units each time they visit the site.
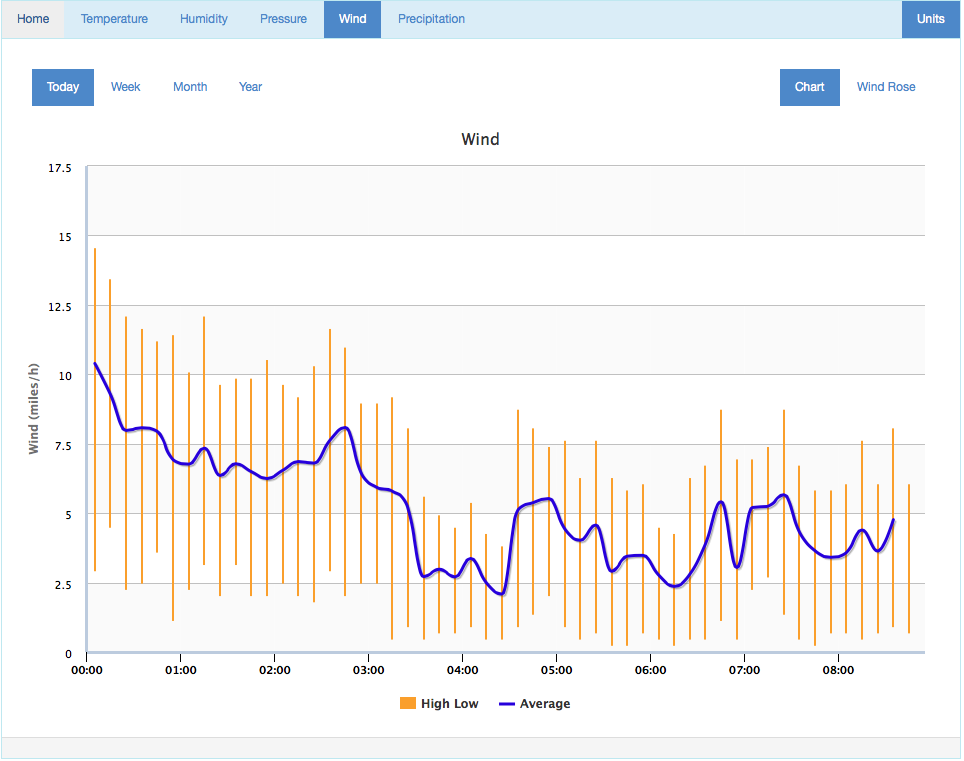
The Weather Report includes charts one day, week, month and year period for the five indicators. You can select one of them just by selecting one of the tabs.
This is for example wind speed high/low/average over one day.
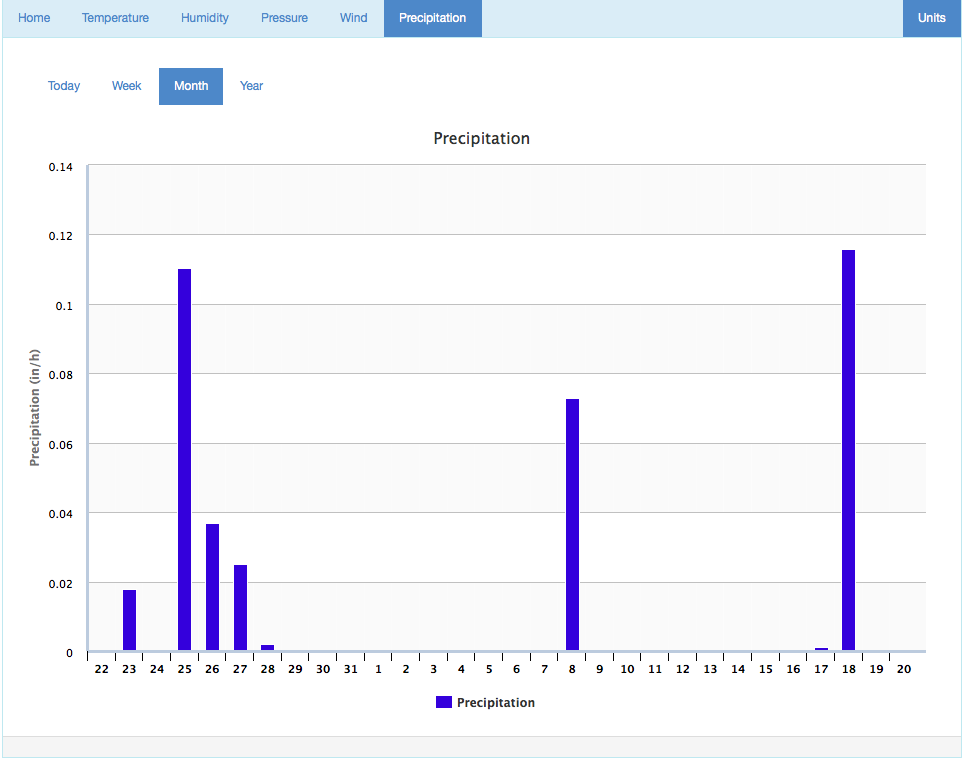
Another example, daily rainfall over one month.
The Weather report lets you choose the units you want to use in the applications. You just need to do this once, since your preferences are stored locally.
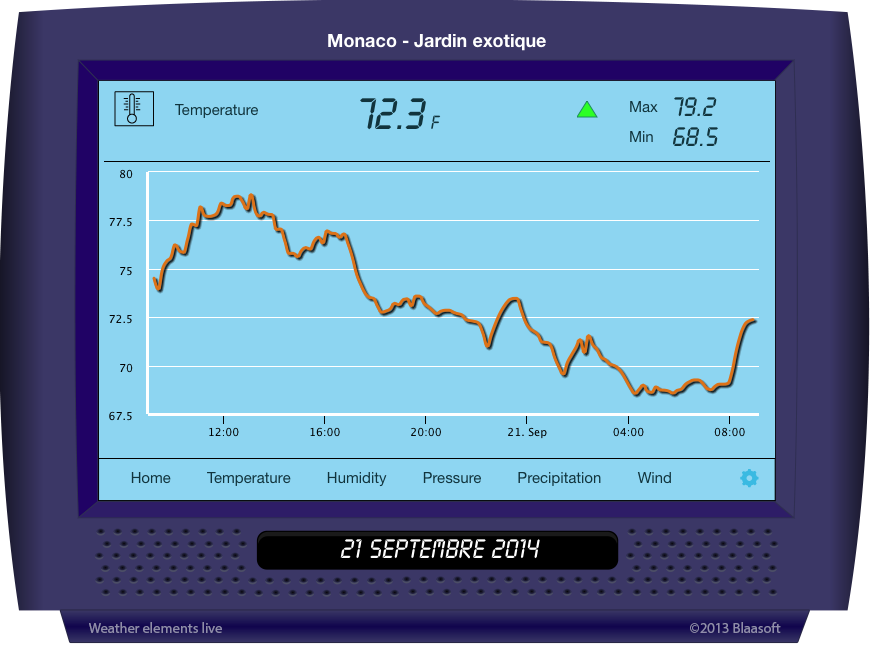
WxConsole
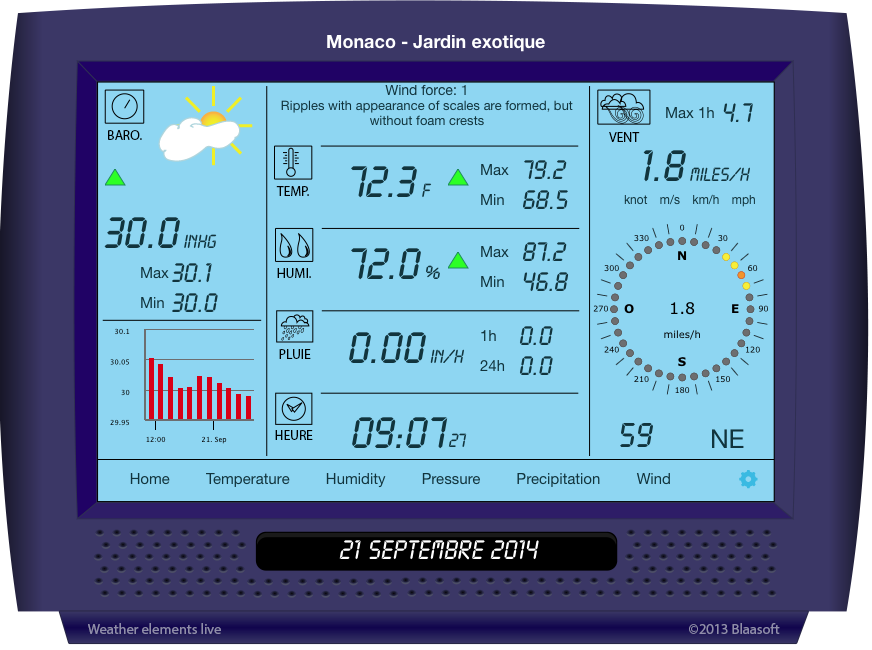
The WxConsole displays provides realtime information and one day charts.
The main panel.
The temperature panel.